Overview
During the course of a sample preparation, contamination can occur from the environment, the reagents, the apparatus, and even the analyst. In many cases the blank determines the lower limit of detection. The next several parts of this guide deal with contamination.
Environmental contamination is caused by particulate and/or gaseous matter in the air. It has been reported that air in an analytical laboratory can contain up to 200 µg/m3 of particulate matter containing Ca, Si, Fe, Na, Mg, K, Tl, Cu, Mn, and lesser amounts of other elements1. In addition, this reference states that normal rural area airborne particle counts have been reported to be 1,400,000/m3 for particles greater than 0.5 µm and that normal metropolitan area particle counts have been reported to be 53,000,000/m3 for particles greater than 0.5 µm.
Reducing Environmental Contamination
Use the chemical blank as the performance criteria. Dealing with environmental contamination is expensive. Therefore, reduce the blank to the lowest possible value by eliminating contamination from the sample container, the chemist, and sample preparation apparatus. Achieve this by doing the following:
- Separate the sample preparation and handling area from all other areas.
- Eliminate as many foreign objects as possible from the preparation area (i.e. - Motorised objects such as stirring plates).
- Use all-plastic hoods.
- Keep the sample out of the hood area as much as possible.
The effect of the laboratory atmosphere on lead blank levels is shown in Table 8.1.
Table 8.1: Effect of Laboratory Atmosphere on Pb Blank Levels
| Pb found in 1 mL of Acid | |
|---|---|
| Acid Blank | 2 |
| Covered for 2 hrs on bench | 1, 1.5 |
| Uncovered for 2 hrs on bench | 5.5, 6.2 |
| Covered in hood for 3 hrs | 4.5 |
| Uncovered in hood for 3 hrs | 25 |
Hoods, which enhance atmospheric exposure and hence contamination, are necessary for the safety of the analyst. Atmospheric contamination has been reduced significantly through the use of "clean rooms" that use HEPA filtered air. HEPA (High Efficiency Particulate Air) filters are 99.99 % efficient in removing particulates down to 0.3 µm.
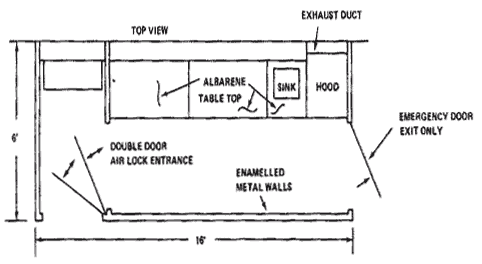
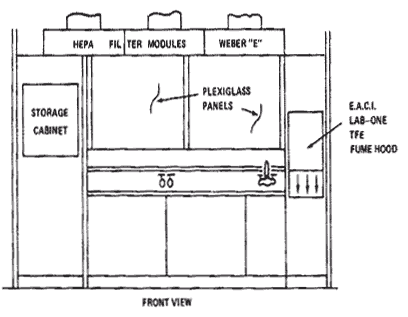
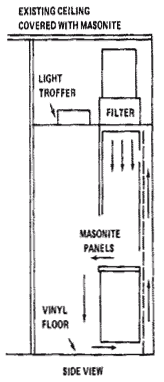
A Positive Pressure Filtered Air "Clean" Room is shown in the following architectural diagrams.
Diagram 8.1: Clean Room Layout (Top View)

Diagram 8.2: Clean Room Layout (Front View)

Diagram 8.3: Clean Room Layout (Side View)

The effectiveness of clean rooms in eliminating environmental contamination is illustrated in Tables 8.2 and 8.3 which show a significant reduction in the blank.
Table 8.2: Analytical Results for Trace Impurities in Ultra-Pure Nitric Acids2
(Concentrated in Conventional Chemical and Clean Rooms)
| Na | Ca | Fe | Zn | Pb | |
|---|---|---|---|---|---|
| A) Conventional chemical room Found value (ng/mL) | 5.4 | 2.2 | 2.4 | 0.45 | 0.29 |
| RSD(%) from 9 samples A) | 13 | 14 | 63 | 20 | 38 |
| RSD(%) in 5 days B) | 11 | 13 | 13 | 10 | 12 |
| (B) Clean room Found value (ng/mL) | 0.84 | 0.8 | 1.3 | 0.051 | 0.038 |
| RSD(%) from 9 samples | 40 | 41 | 31 | 61 | 63 |
| Reference value (ng/mL) C) | 0.39 | 0.2 | 0.56 | <0.05 | <0.01 |
| Difference of the value between (A) and (B) | 4.6 | 1.4 | 1.1 | 0.4 | 0.25 |
Table 8.3: Analytical Results for Trace Impurities in Ultra-Pure Water Samples2
(Concentrated in Conventional Chemical and Clean Rooms)
RSD(%) in 5 days B)1113131012
| Na | Ca | Fe | Zn | Pb | |
|---|---|---|---|---|---|
| A) Conventional chemical room Found value (ng/mL) | 3.2 | 1.9 | 2.5 | 0.2 | 0.14 |
| RSD(%) from 9 samples A) | 11 | 20 | 48 | 60 | 45 |
| (B) Clean room Found value (ng/mL) | 0.45 | 0.27 | 0.17 | 0.025 | 0.013 |
| RSD(%) from 9 samples | 110 | 120 | 100 | 60 | 240 |
| Reference value (ng/mL) B) | <0.005 | <0.005 | <0.01 | <0.005 | <0.01 |
| Difference of the value between (A) and (B) | 2.8 | 1.6 | 2.3 | 0.18 | 0.13 |
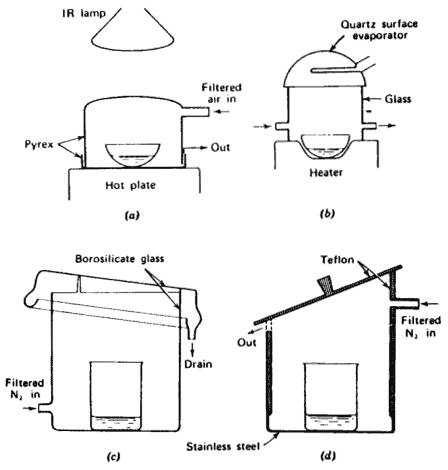
For budgets that cannot handle the cost associated with clean room facilities there have been several ingenious designs that are effective in dealing with environmental contamination. Diagram 4.4 illustrates some of these designs using equipment that is relatively inexpensive and easily obtained
Diagram 8.4: Evaporation Chamber Designs1

My Wishlist
Wishlist is empty.
